What did we hear?
What makes a place that you are visiting sound different from home? Sometimes you know immediately what is making a sound because it is relatively common and sounds about the same wherever you go (e.g., train passing by, airplanes taking off, truck backing up). Other sounds might be harder to figure out: What bird makes that call? Is that a baby crying in the distance?
The sounds produced by animals are made up of specific pitches, or frequencies. Some extend below the frequencies that human ears can reliably hear, like blue whale calls. Other animal sounds extend higher than what humans can reliably hear, like dolphins. Similarly, people introduce sounds into the marine environment that contain specific frequencies. The bursting of bubbles off boat propellers produce sounds that span a wide range of frequencies, with their spectrum giving hints to their size. Natural environmental forces like wind and waves produce sound underwater that are heightened at specific frequencies and can be used to track the presence of storms and other weather activity at recording locations.
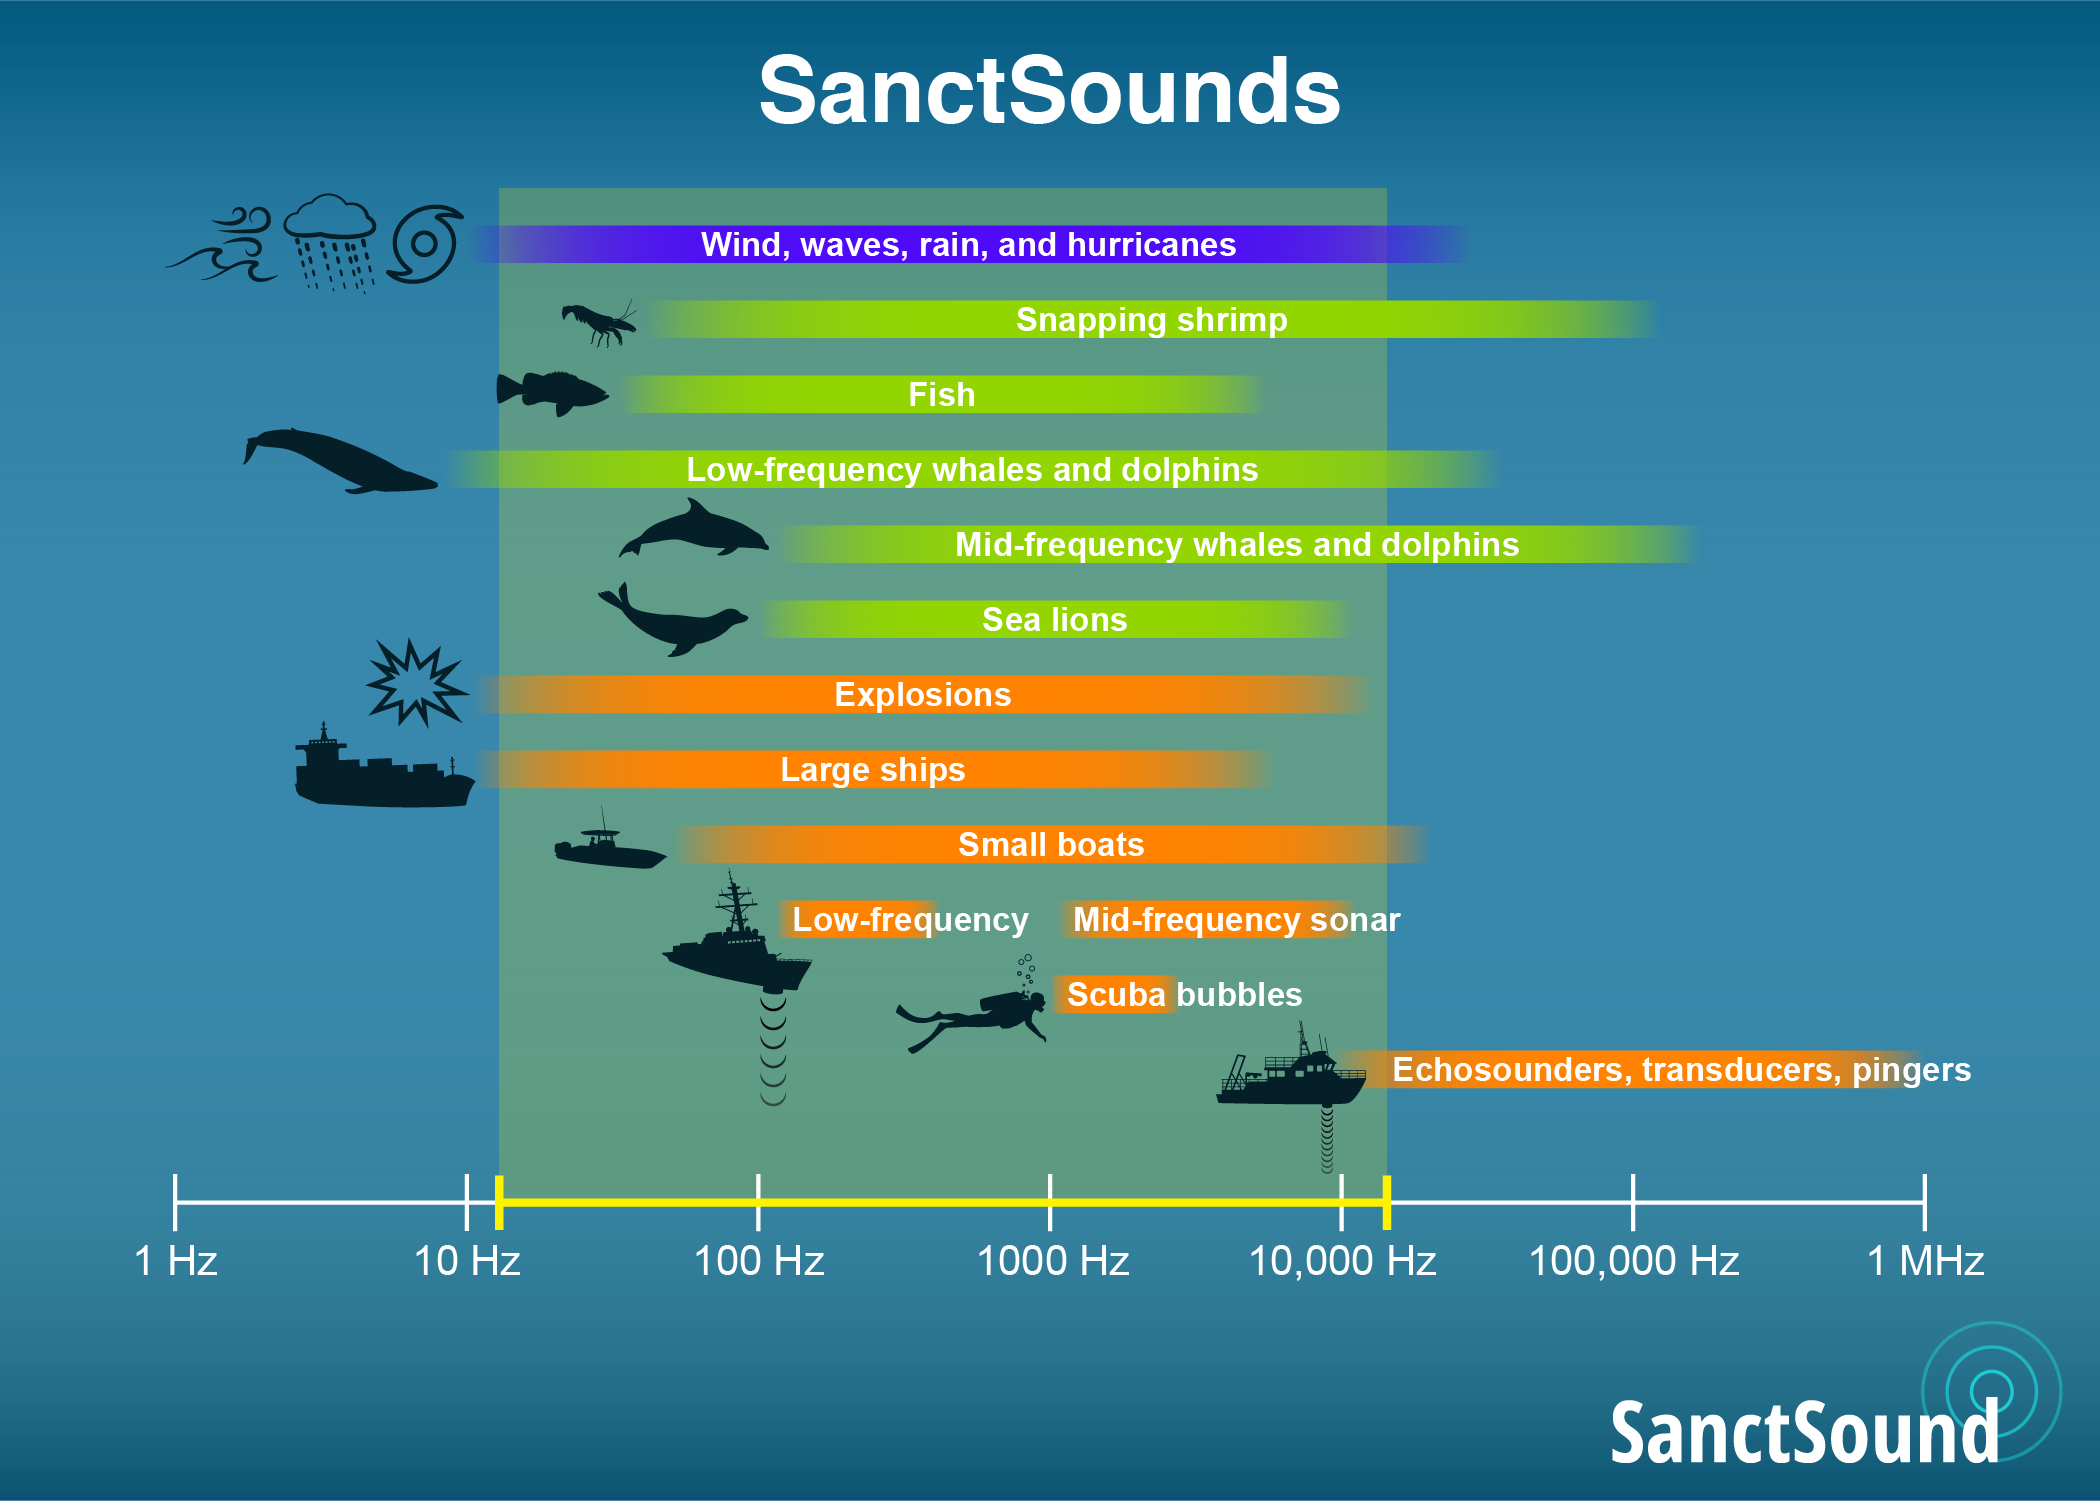
There are many sources of sound in sanctuaries. This graphic highlights the sound sources that we focused on in the SanctSound project, including physical (purple bar), animal (green) and human-made (orange). The width of the bars indicates the range of frequencies (or pitches) that are typical of that sound source. For comparison, the yellow bar shows the hearing range of humans in air, and is also the range of frequencies that were recorded by SanctSound hydrophones.
SanctSound recorders heard a variety of sounds, including physical processes, animals, and human activities. Invertebrates (like snapping shrimp), fish, whales, vessels, fishing activities, and sonars used in military training are a few of the expected and relatively well-characterized sources of sound recorded throughout the project. Only a few types of sounds were present at all recording locations. These included the underwater sounds made by vessels both big and small.
Under the “What did we hear” tab for each sanctuary, interactive infographics showcase the many different sources of sound that we identified and tracked through our recording efforts. Clicking on a sound source icon on the infographic opens a window where you can listen to a sound clip recorded at that sanctuary and, for some sources, learn more about daily, monthly or annual patterns that were detected in that sanctuary. These scenes only include sources of sound tracked by the project and do not include all the species and activities that may create underwater sound in the sanctuaries.
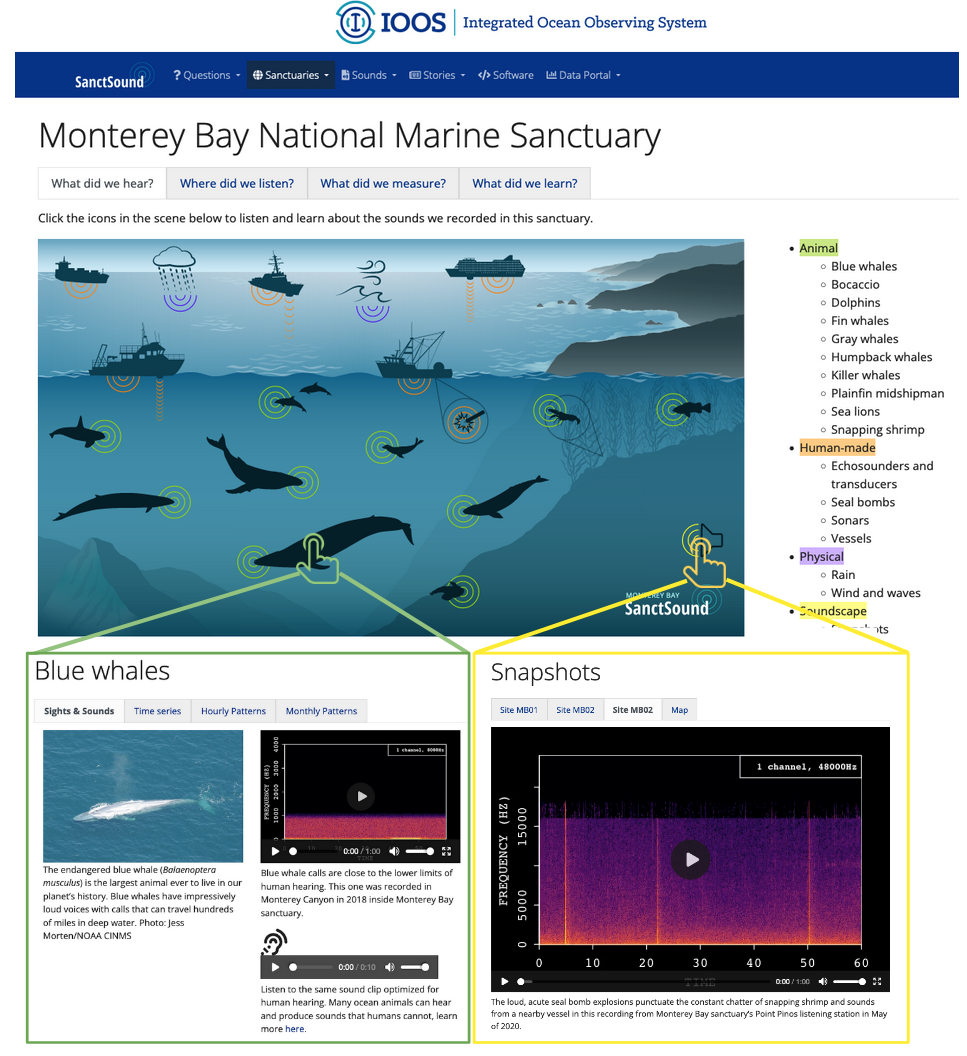
Some of the sounds that we recorded, like blue whale calls, extend below the frequencies that human ears can easily hear and that the speakers on typical electronic devices can reliably produce. For these cases, we have included the original sound clip recorded as well as a version of the clip optimized for human hearing. In addition to providing sound clips of specific sound sources, we also wanted to provide examples of what it sounds like when some of these sound sources co-occur. These “soundscape snapshots” help illustrate what the sanctuary sounds like in a certain place and time.
One tool for better understanding the differences among different sounds is a spectrogram. A spectrogram uses color to show the intensity (or loudness) at different frequencies (or pitches) over time. In SanctSound spectrograms, louder sounds are shown in warmer colors. Vertically you can see whether sound is more or less intense at different frequencies. When you play a sound and view its pattern in a spectrogram, you get a better sense of a sound’s composition.
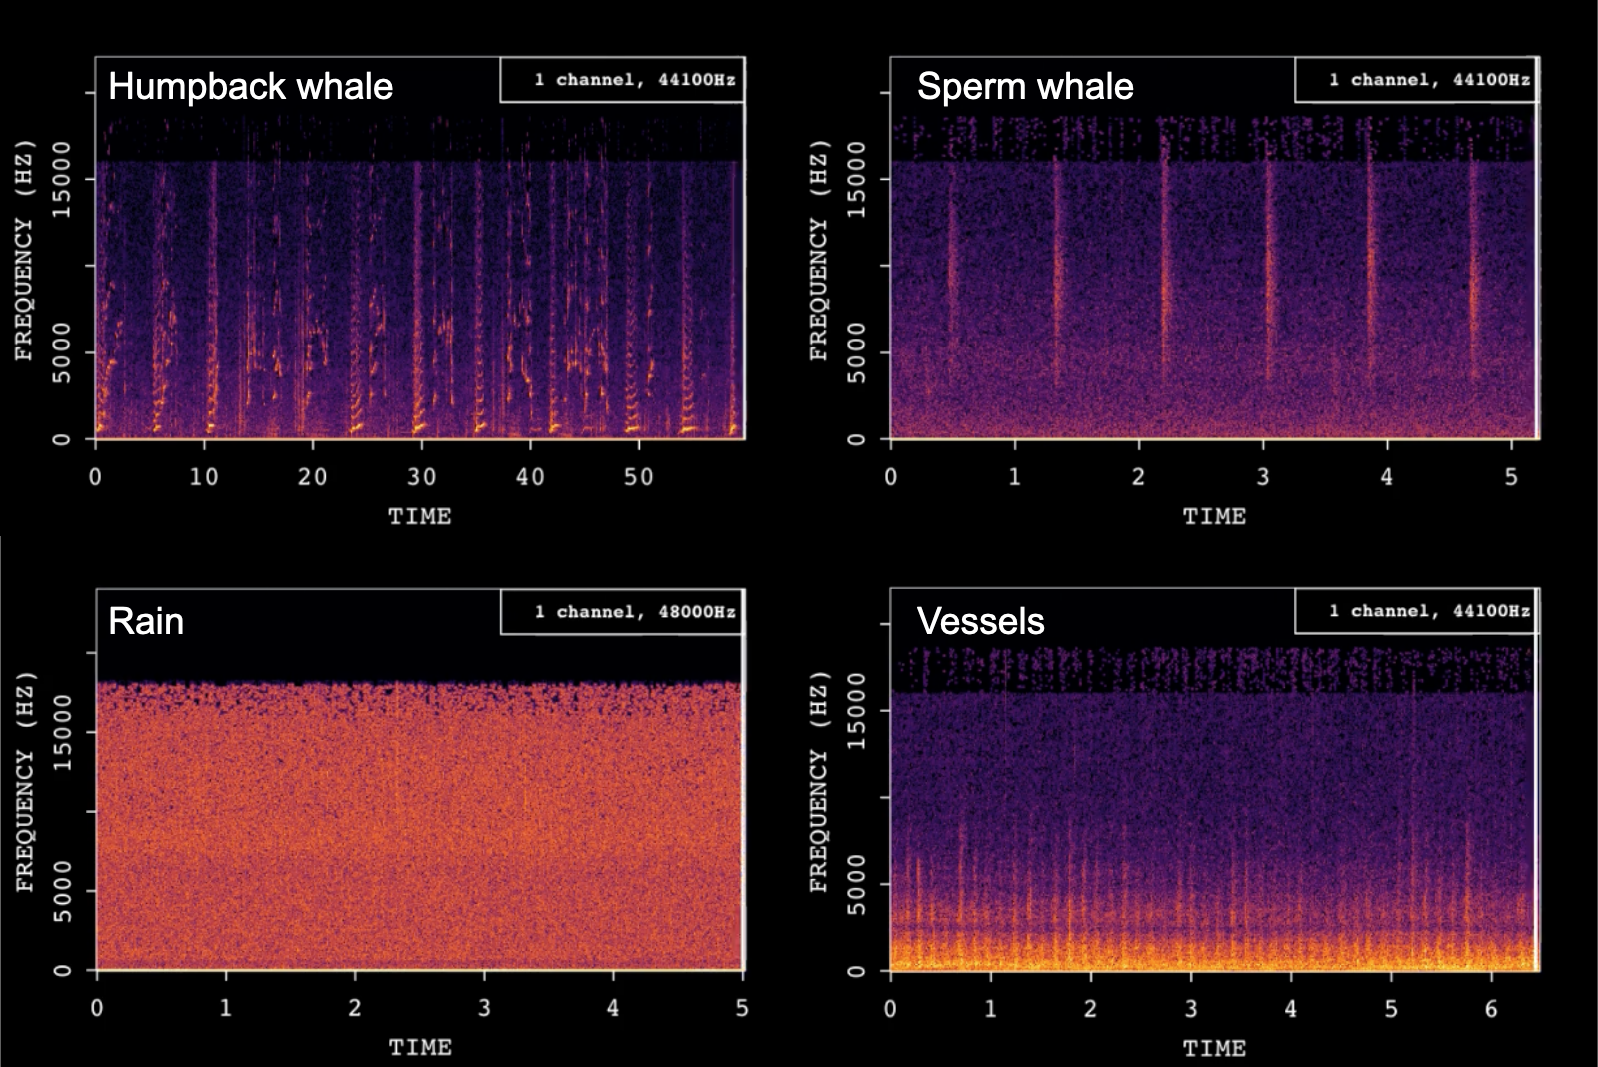
In these example spectrograms recorded in Hawaiian Islands Humpback Whale National Marine Sanctuary, you can see and hear the varied pitches and note types that make up humpback whale songs, the simpler and highly repetitive clicks made by sperm whales, the blurry underwater signature of rain on the ocean’s surface, and the lower frequency blade signature made by the propellor of a nearby vessel.
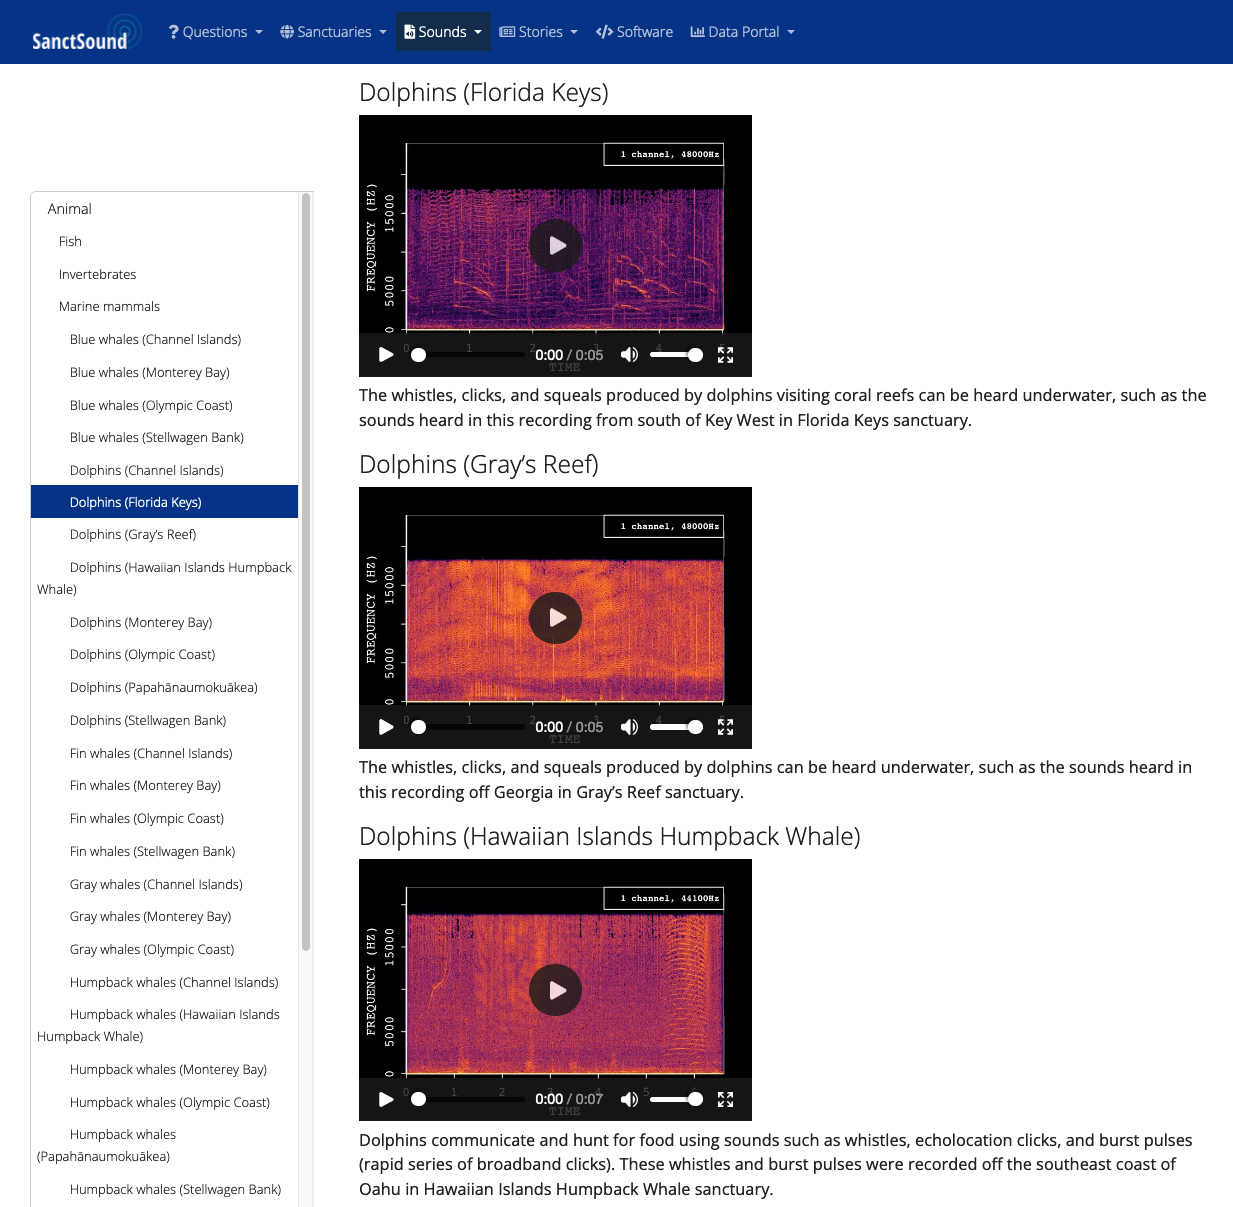
The ‘Sounds’ pull down in the Navigation Bar takes you to the Example Sounds page, which contains all the sound clips available through the interactive infographics across all eight sanctuaries.
To access additional sound clips available in the SanctSound data portal, select ‘Sound Library’ under the ‘Data Portal’ pull down in the Navigation Bar.
While there are many sounds of unknown origin in our data, sounds that are well described and relatively consistent can be “detected” by automated processes. Because computers aren’t perfect, scientists verify the automated detection results. This process allows us to determine how the automated detector performed in different places, including how well it worked in a louder environment or for specific types of sound.
There are many ways to showcase the contributions of known sounds detected at recording locations. Sounds produced by animals often peak during specific periods of the day, and during specific months or seasons based on the roles the sound plays in the animals’ reproductive, feeding or migratory activity. For many of the sound sources in a sanctuary, we show how frequently the sound was detected during the project’s 3 year recording period. For example, we can graph the number of times a certain sound was detected to determine when that sound is a more or less important component of the sanctuary soundscape throughout the year.
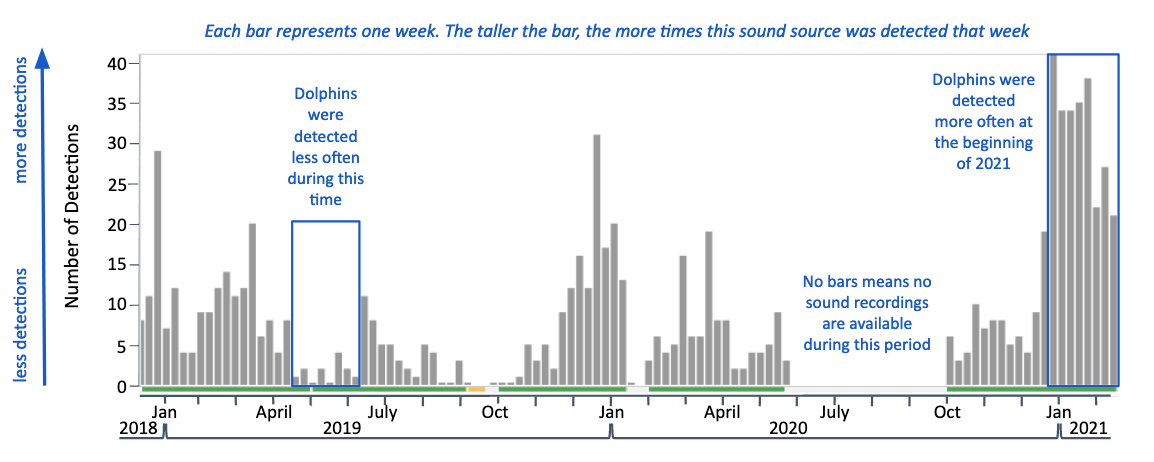
This plot shows the occurrence of dolphin sounds detected at a listening station in Gray’s Reef National Marine Sanctuary.
We can also compare how detections varied over seasons by plotting that information on a graph that looks like a 12 hour clock.
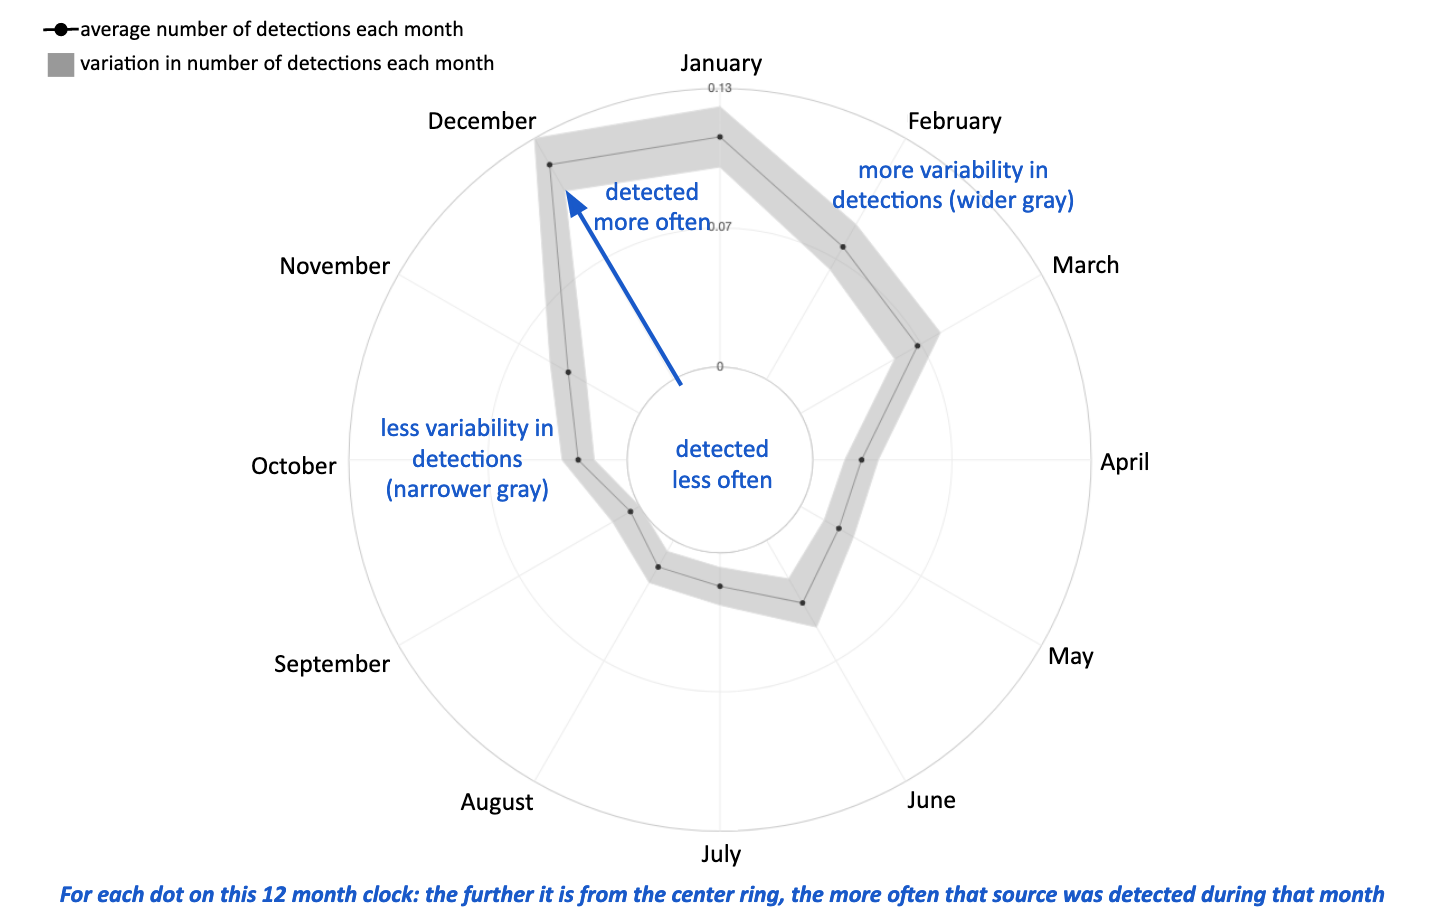
For example, at this site in Gray’s Reef National Marine Sanctuary, dolphin sounds were recorded most often in the winter months with some degree of variability in all months (grey band) during the three years of recording effort.
We didn’t always collect information on detections within a day. For the sound sources that we looked for by hour, we can plot their occurrence on a graph that looks like a 24 hour clock.
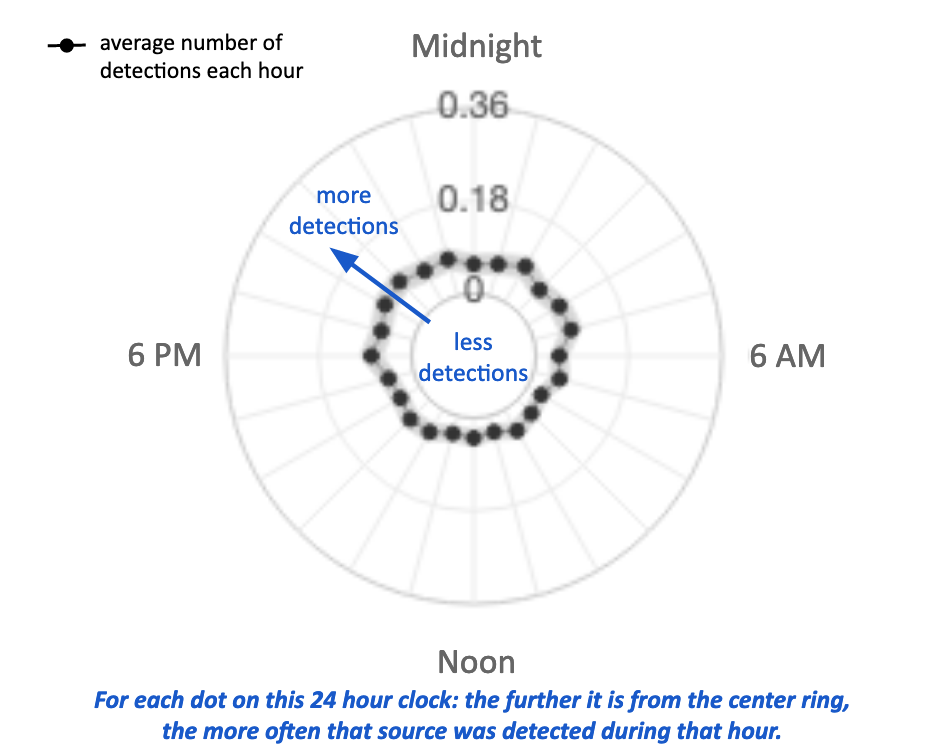
For example, at this site in Gray’s Reef National Marine Sanctuary, dolphin sounds were detected across all hours of the day but tended to be detected more during nighttime hours.
These types of monthly and daily patterns are shown under the ‘What did we hear’ tab for many of the sound sources on a sanctuary’s interactive infographic.
For those interested in a deeper exploration of detection patterns within and across sanctuaries, select ‘Home’ from the ‘Data Portal’ pull down in the Navigation Bar.