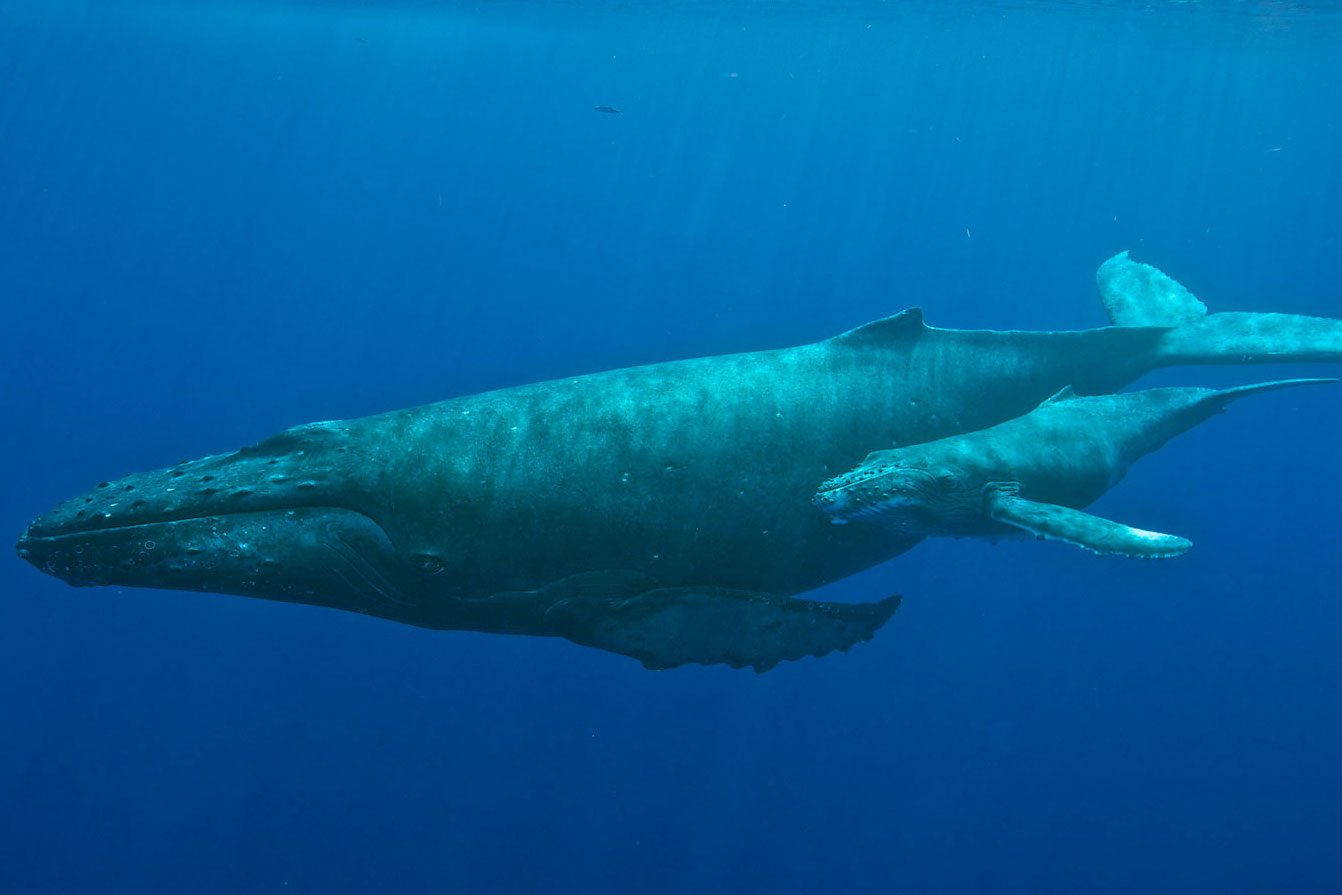
Hawaiian Islands Humpback Whale National Marine Sanctuary
What did we hear?
Click the icons in the scene below to listen and learn about the sounds we recorded in this sanctuary.
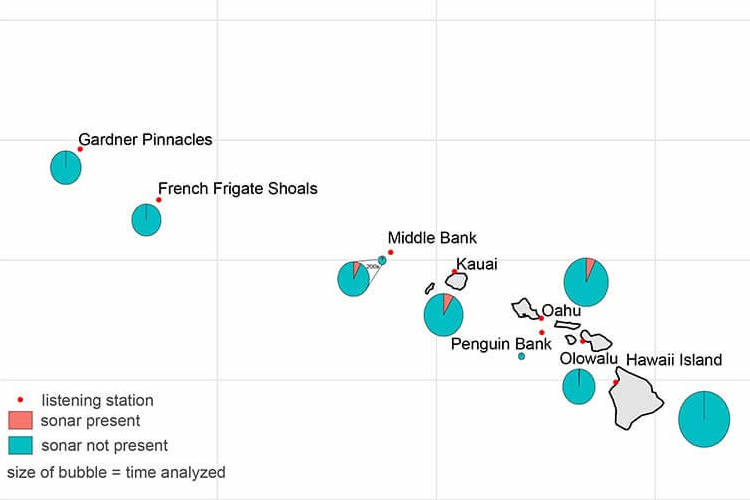
Where did we listen?
Here is a map of listening device locations. Hover on a location to see its site id and click on it to see the rationale for its placement.
Learn more about how we
listened to and recorded
soundscapes.
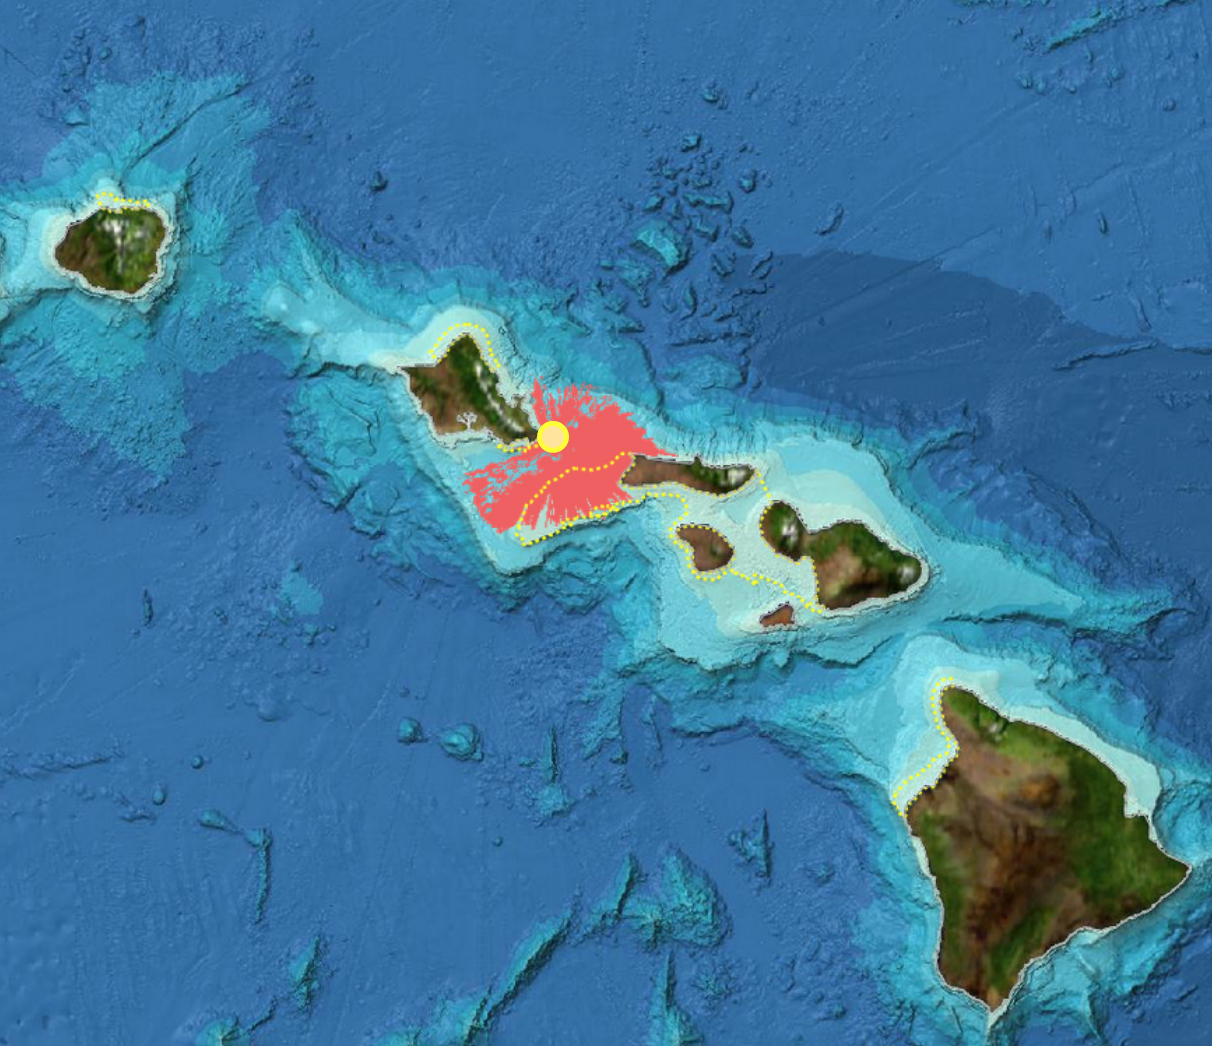
See similar maps
of the listening range for the other hydrophones in this
and in other sanctuaries.
What did we measure?
Spectrogram: intensity of sound at different pitches over time
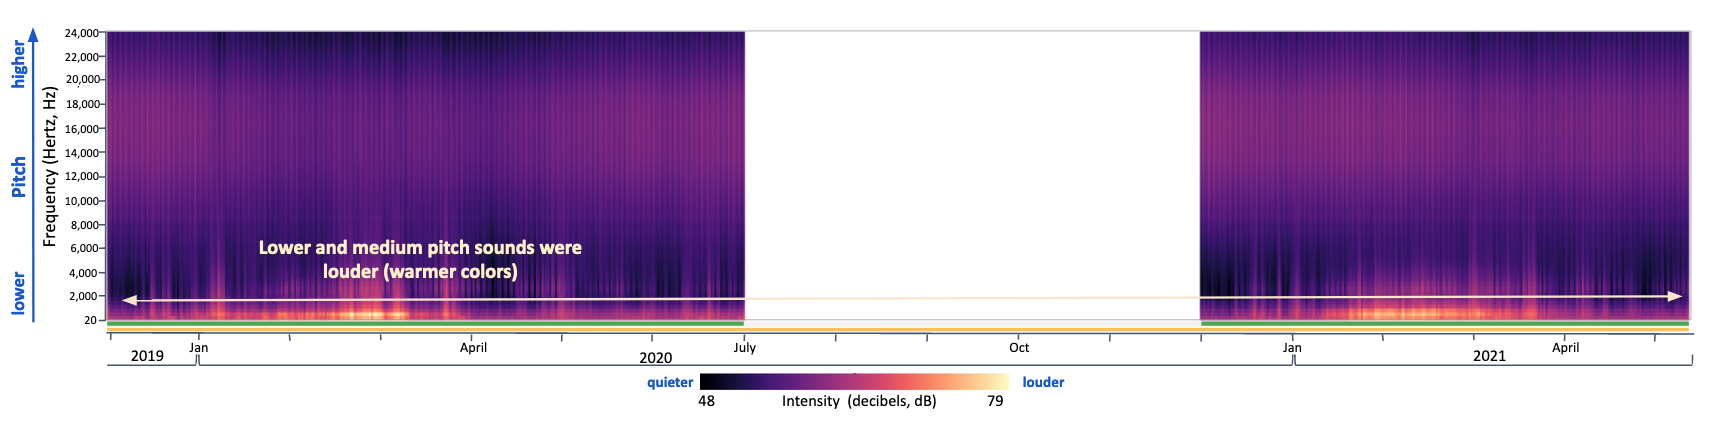
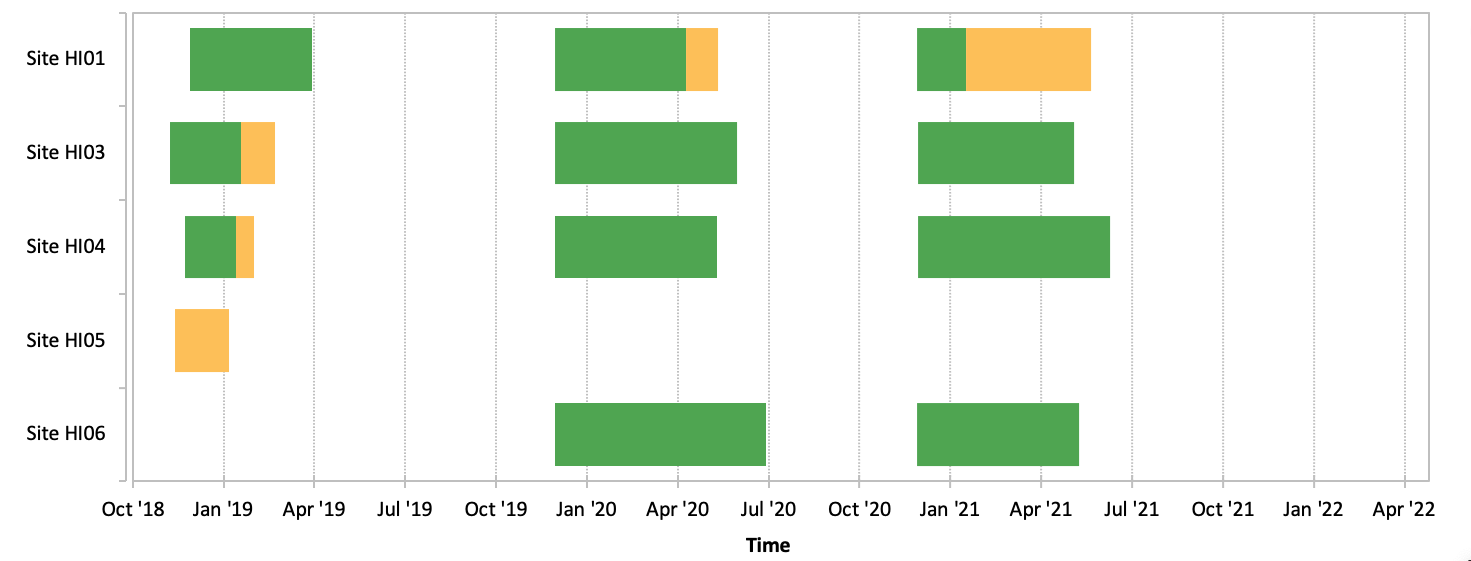
This example spectrogram from a listening station off the northwest coast of Hawaiʻi island in Hawaiian Islands Humpback Whale sanctuary shows that sound levels were louder (warmer colors) at lower and medium pitches, reflecting the contribution that singing humpback whales make to the wintertime soundscape at this site. Information about the quality of the sound data is included along the bottom of the plot with green indicating time periods of good quality data and data gaps shown with white.
Sound levels above median: loudness and contribution of different pitches
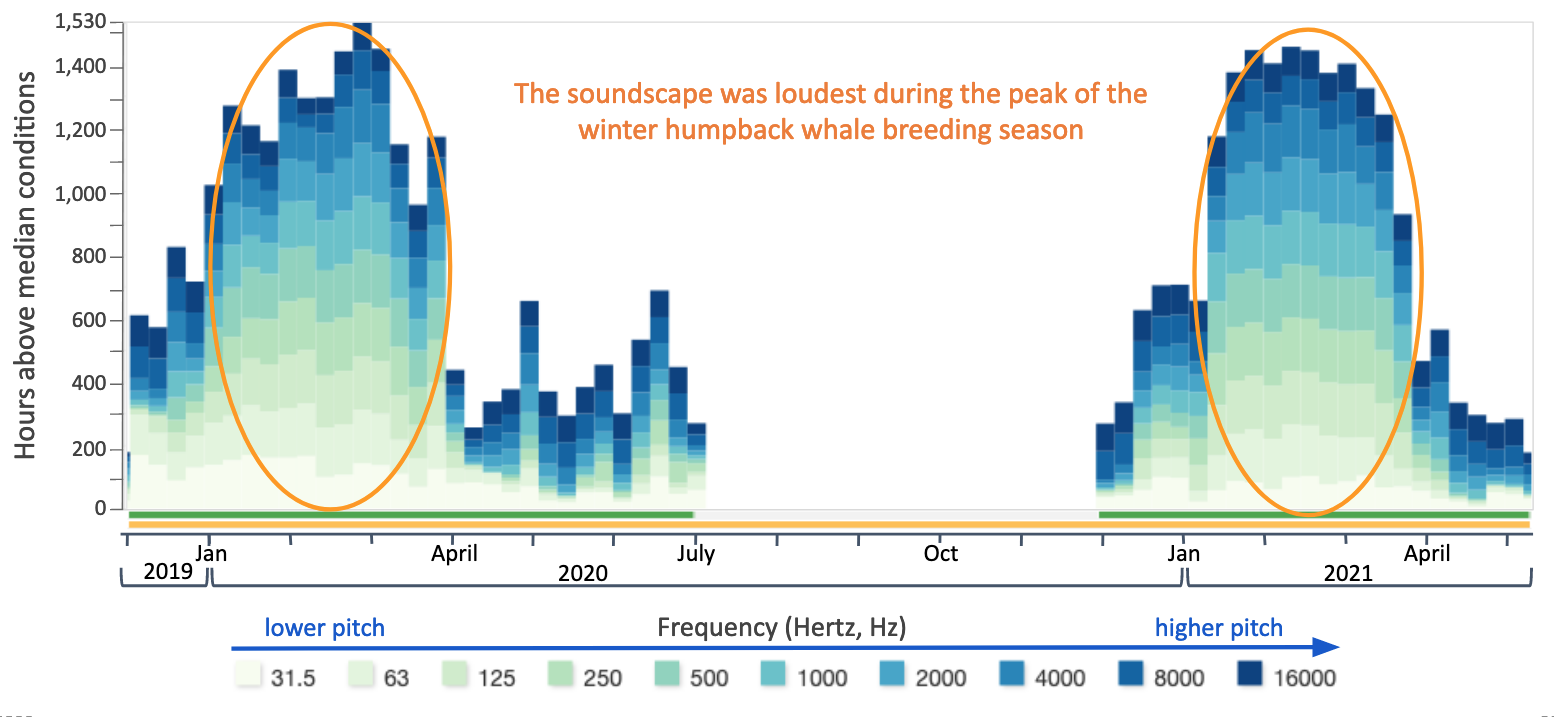
This histogram of above-median sound levels from a listening station off the northwest coast of Hawaiʻi island in Hawaiian Islands Humpback Whale sanctuary shows the seasonal variability in the soundscape, with the wintertime months having higher overall sound intensity due to the chorusing of male humpback whales showing the beginning, peak, and end of the humpback whale breeding season at this site. Data quality is shown in color as described above.
Power spectrum: variability of loudness across pitch

This power spectrum plot from a listening station off the northwest coast of Hawaiʻi island in Hawaiian Islands Humpback Whale sanctuary shows that sounds ranging from 200-20,000 Hertz had the highest median intensities (black line). However, a range of medium pitched sounds (200-3,000 Hertz) were more variable over time (wider gray band) representing the frequency range of seasonal humpback whale song detected at this site. Sounds with frequencies below 100 Hertz and above 5,000 Hertz were generally less variable throughout the study period (narrow gray band).
Anomaly plot: deviation of loudness from average
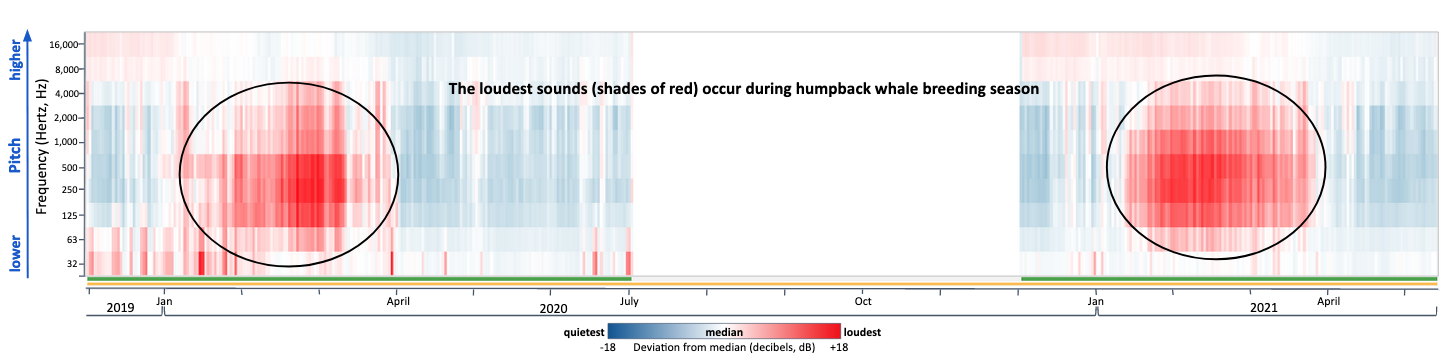
This sound levels anomaly plot from a listening station off the northwest coast of Hawaiʻi island in Hawaiian Islands Humpback Whale sanctuary shows the same seasonal variation seen in the histogram but more clearly identifies the pitches of sound that are higher than the median (shades of red) when humpback whales are present and lower than the median (shades of blue) when they are absent. Data quality is shown in color as described above.
Learn more about what we measured and how to read and understand these summary graphs.
See similar summary graphs for the other stations in this sanctuary and here for data available in other sanctuaries.