Olympic Coast National Marine Sanctuary
What did we hear?
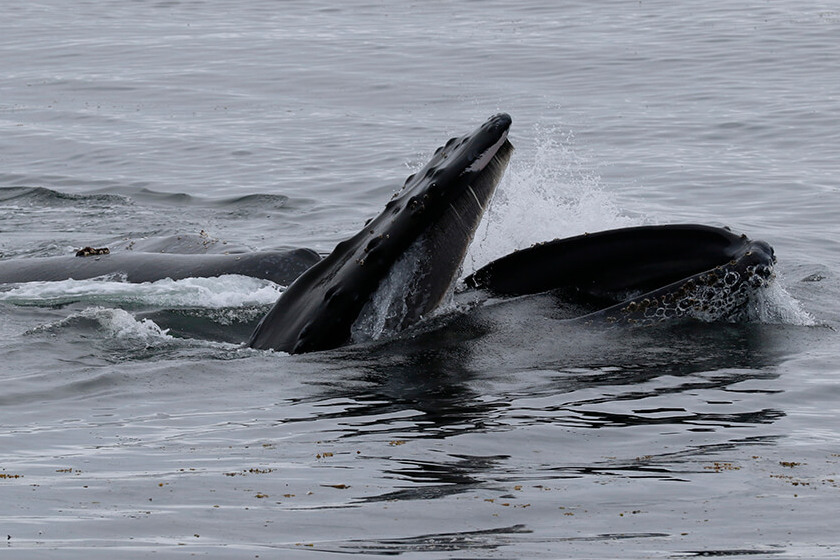
Click the icons in the scene below to listen and learn about the sounds we recorded in this sanctuary.
Where did we listen?
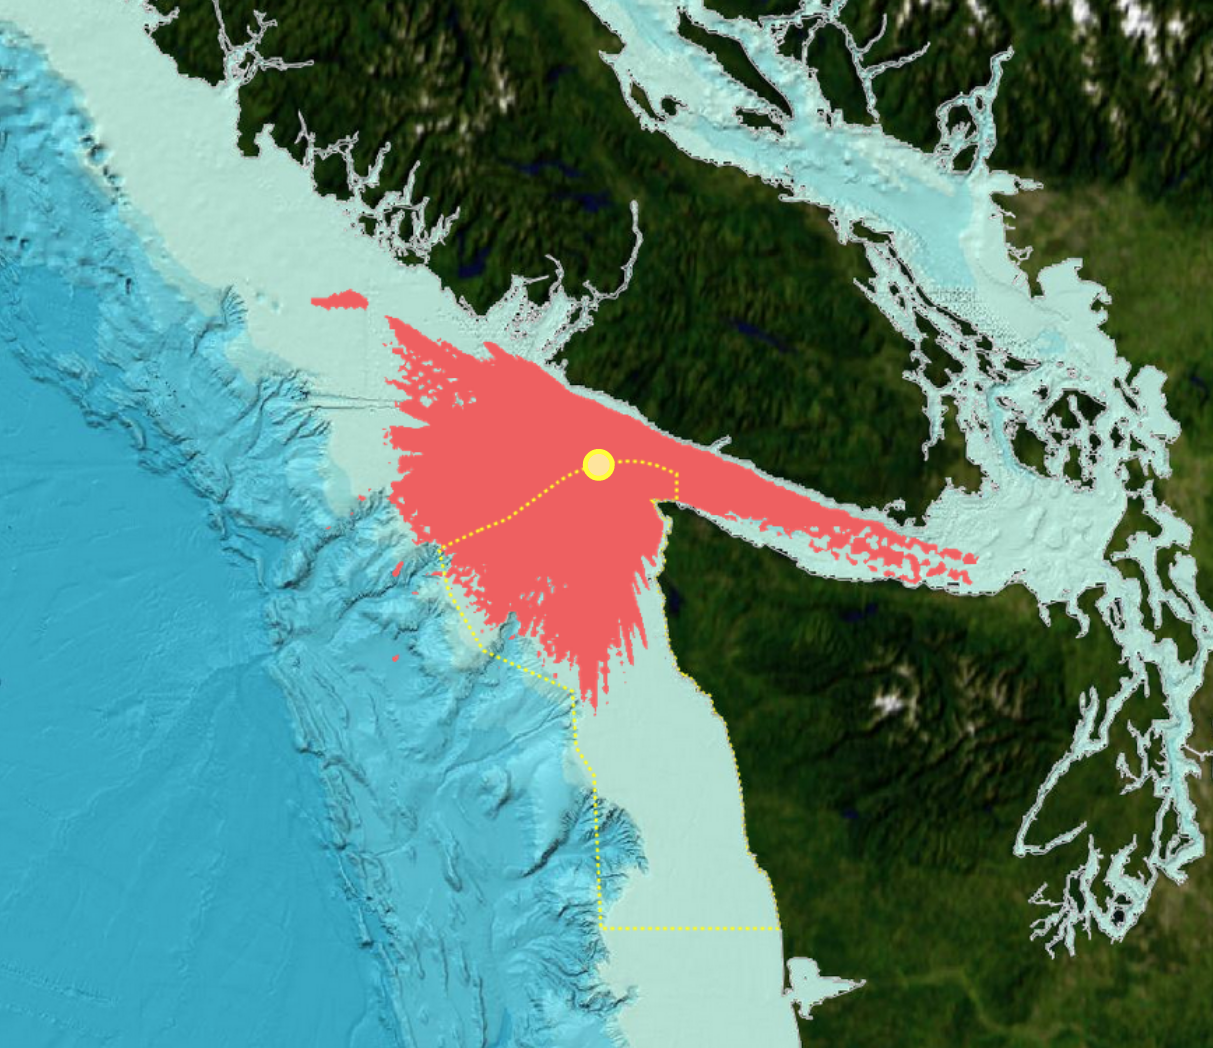
Here is a map of listening device locations. Hover on a location to see its site id and click on it to see the rationale for its placement.
Learn more about how we
listened to and recorded
soundscapes.
See similar maps
of the listening range for the other hydrophones in this
and in other sanctuaries.
What did we measure?
Spectrogram: intensity of sound at different pitches over time
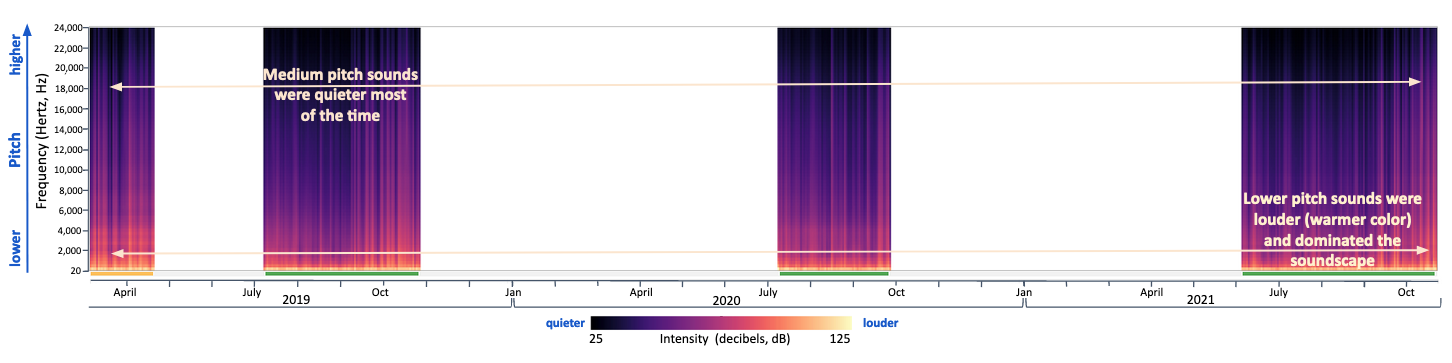
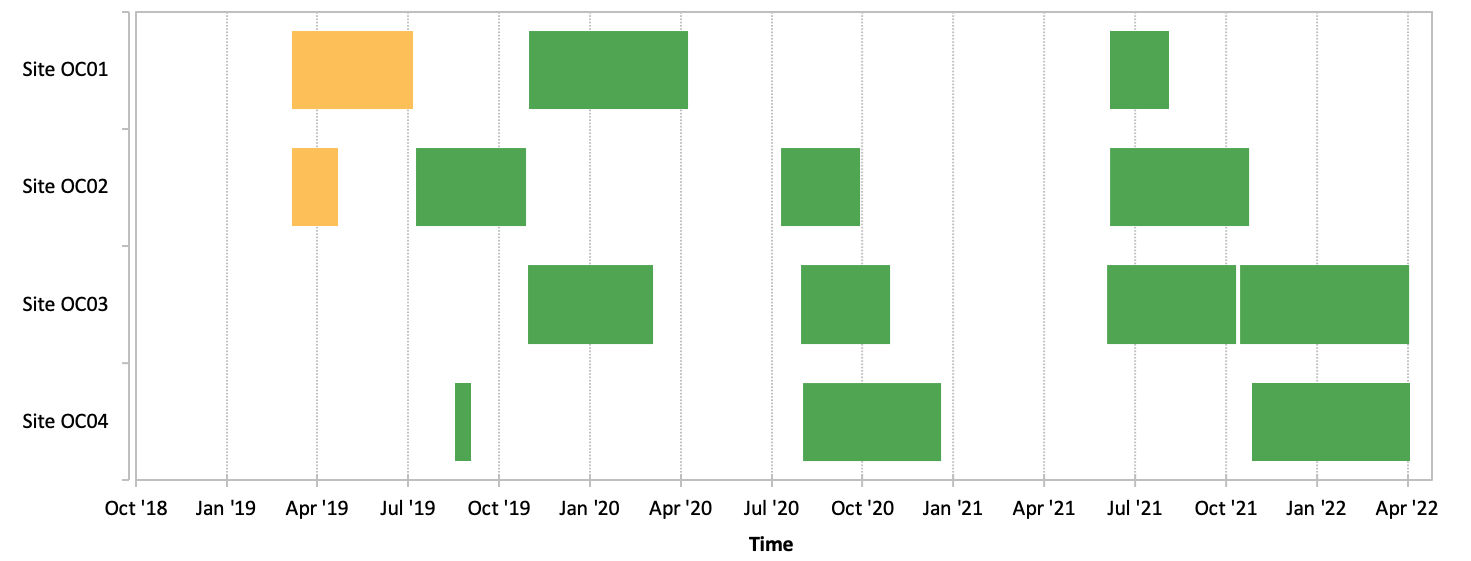
This example spectrogram from a listening station at the northern border of Olympic Coast sanctuary shows that sound levels were louder (warmer colors) at low pitches and quieter (cooler colors) at medium and high pitches, capturing contributions of consistent international large vessel traffic in and out of the Strait of Juan de Fuca. Information about the quality of the intermittent sound data available is included along the bottom of the plot with green indicating time periods of good quality data, yellow indicating periods with compromised data, and data gaps shown with white. In the data portal, you can get more information about what frequencies of data are compromised during a time period by hovering over each yellow color bar.
Sound levels above median: loudness and contribution of different pitches
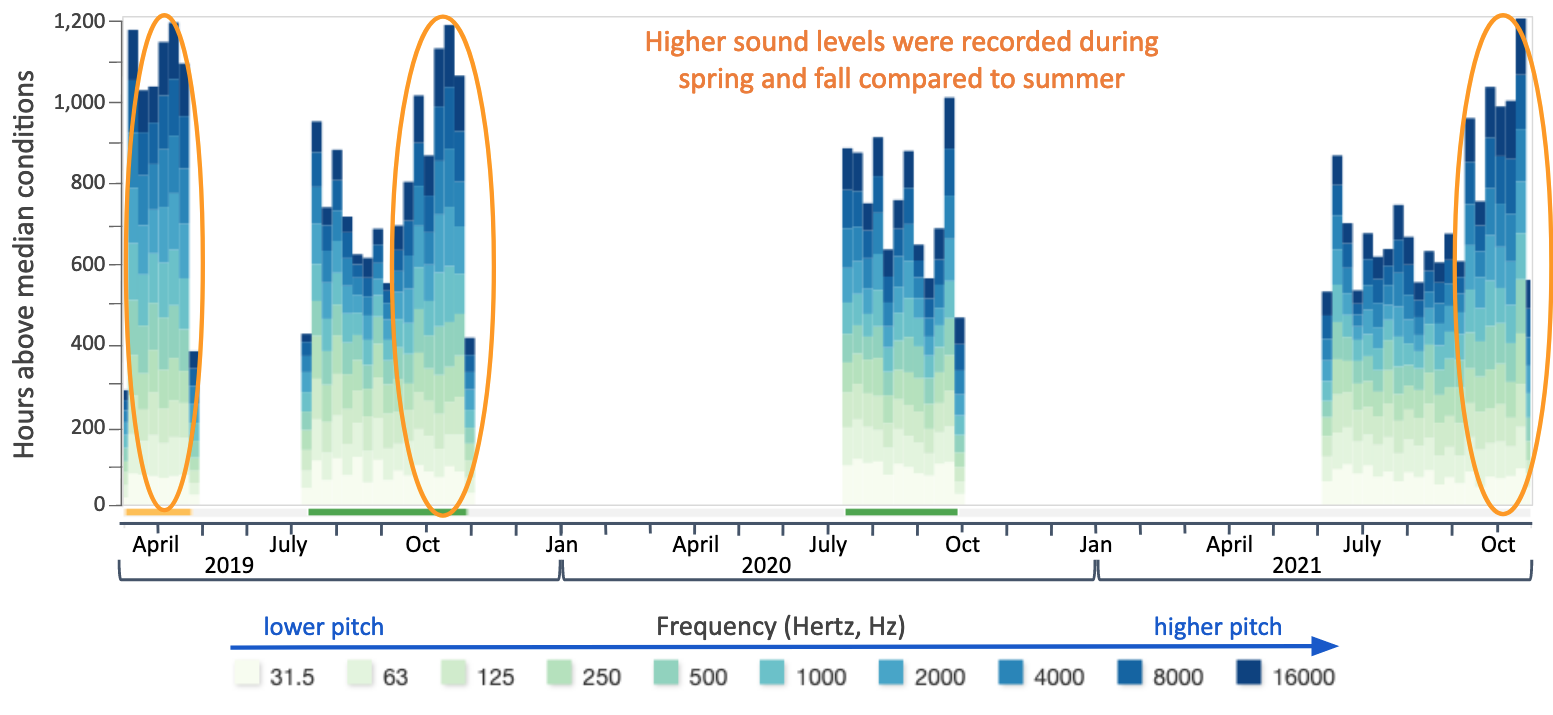
This histogram of above-median sound levels for a listening station at the northern border of Olympic Coast sanctuary shows some variation in the sound levels in the international shipping lanes. Based on the intermittent data available there is a slight suggestion that sound levels were highest in spring and fall, a potential pattern that could be explored with more data collection. Data quality is shown in color as described above.
Power spectrum: variability of loudness across pitch
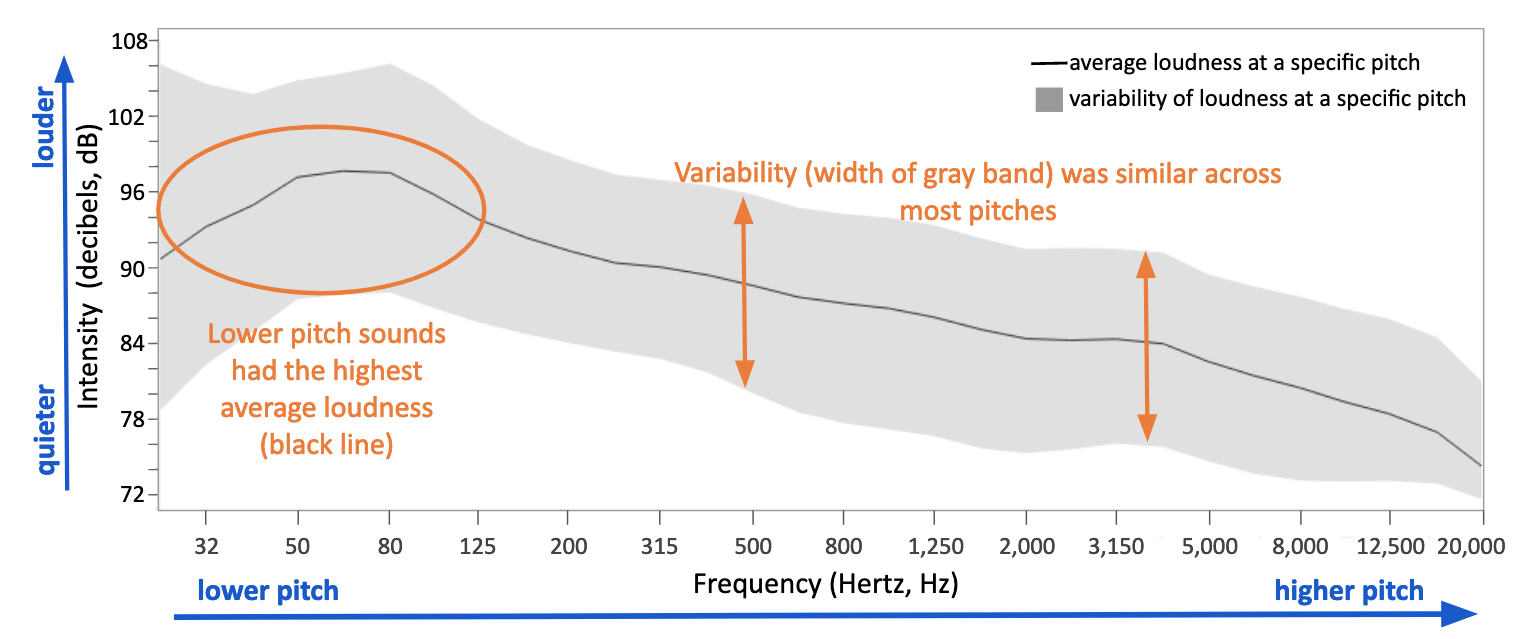
This power spectrum plot for the listening station at the northern border of Olympic Coast sanctuary shows that a narrow range of low pitched sounds (25-125 Hertz) had the highest median intensities (black line), which represents large vessel noise contributions from the international shipping lanes. Sound intensity across all frequencies remains fairly constant (not much variation in width of gray band) at this site.
Anomaly plot: deviation of loudness from average

This sound levels anomaly plot for the listening station at the northern border of Olympic Coast sanctuary, inside the international shipping lanes, mirrors the variability displayed in the histogram but provides more information that frequencies above 500 Hertz are driving a possible seasonal pattern of elevated levels (shades of red) in spring and fall. Data intermittent and its quality is shown in color as described above.
Learn more about what we measured and how to read and understand these summary graphs.
See similar summary graphs for the other stations in this sanctuary and here for data available in other sanctuaries.